The challenge
De Montfort University are exploring the use of responsible metrics and the role of institutional repository download data. Philip Adams, senior assistant librarian in content delivery, wanted to use IRUS statistics to look at patterns across the library and university and to explore questions around links between citations and repository usage.
"Can the count of downloads for an item indicate a level of interest in an output when the citation count is low?"
The solution
Philip uses the IRUS API to gather the statistics from IRUS, which he then combines with other data sources using OpenRefine. This has enabled him to link IRUS usage statistics with citation data from SCOPUS.
Philip chooses to use IRUS because he considers it to be more reliable and consistent than other usage data sources, which gives him greater confidence in his findings and saves him time in cleaning the data.
"IRUS removes some obvious robots from the counts so that we don't have to put our time into maintaining our own list of robots. Additionally, lots of other people across the country in similar roles don't have to spend time on doing that either. That's done once, at the highest level through IRUS, so we can have more confidence in the figures that we do download."
OpenRefine allows APIs to run, so Philip creates a spreadsheet of all the items that are in the institutional repository and then sends requests to the IRUS API to collect the number of downloads per item. He can also send off a query to Scopus asking if there is there any record of citations for these items. Philip can then build scatter graphs of things that might be highly cited but not often downloaded, or items that are often downloaded from the institutional repository but have yet to have an impact on citations, perhaps predicting future citations. These graphics can also be broken down by faculty or research institute.
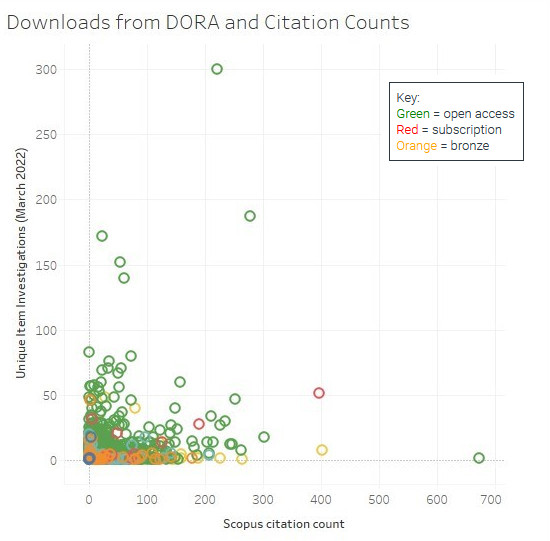
Image supplied by Philip Adams, De Montfort University.
The impact
By using the IRUS API in conjunction with OpenRefine, Philip and the team at De Montfort University have been able to extract and combine article-level data from two sources to build a picture at a university, faculty and research institution level. This has enabled them to begin identifying patterns of use as they investigate these relationships further.